Independent overview by Netops24 — not the official Wireshark Foundation website.
Discovery & Troubleshooting Tools
Wireshark review — packet capture as the referee in a monitoring trial
Wireshark for monitoring buyers: how the free, open-source packet analyzer shows what a trial collector really sends and receives, so you can judge PRTG, Auvik or OpManager on evidence rather than on a confusing dashboard.
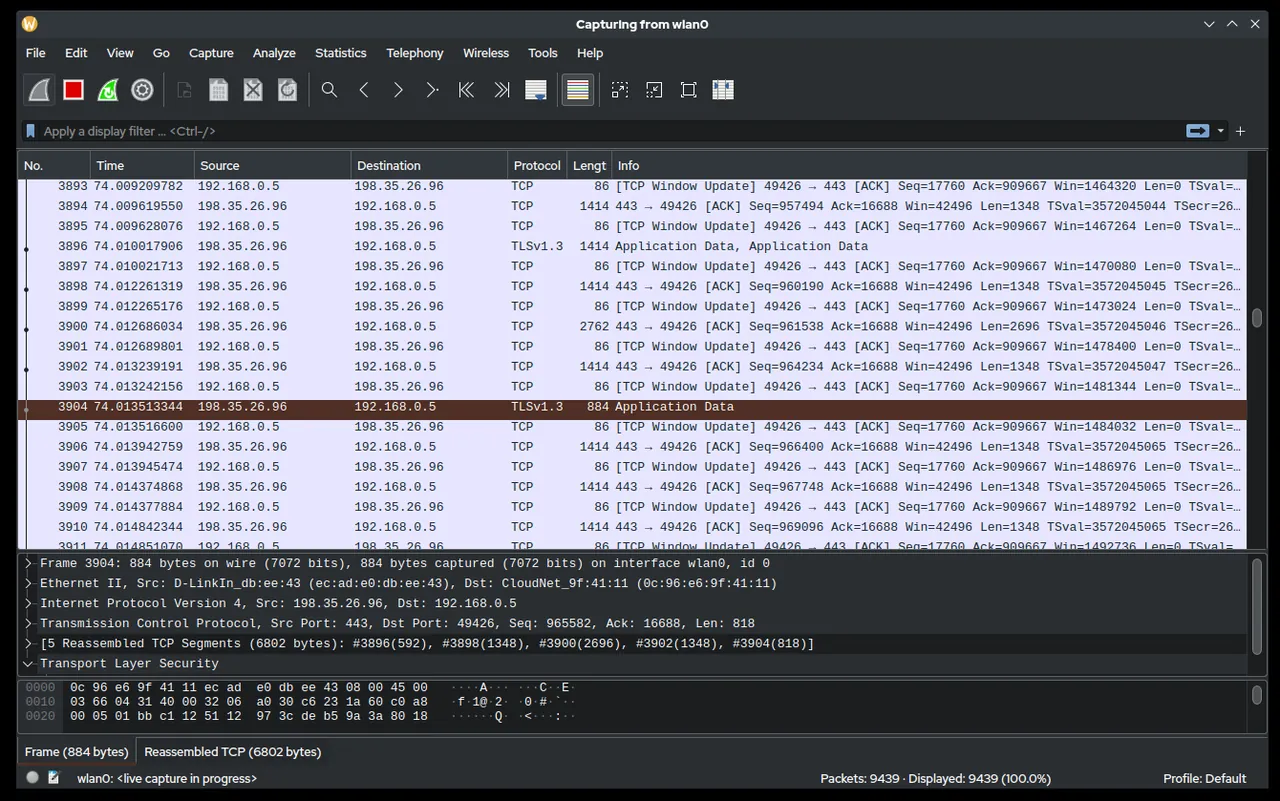
Day six of a monitoring trial, and the new product insists that the core switch in the second building is timing out every few minutes. The switch is fine, users are fine, and the old tool never complained. Either the product is wrong, the credentials are wrong, or something on the path is dropping packets, and the answer decides whether the product stays on the shortlist. Wireshark, the free packet analyzer maintained by the Wireshark Foundation, is how you settle that argument with evidence instead of opinions.
What it does
Wireshark records network traffic on an interface of a machine you control and decodes it, packet by packet, into readable protocol fields. It understands well over a thousand protocols, including every one a monitoring buyer cares about: ICMP for ping checks, SNMP v1, v2c and v3 for polling and traps, NetFlow, IPFIX and sFlow for flow data, syslog, HTTP and TLS for web checks, and the Windows RPC traffic behind WMI.
Two kinds of filter do most of the work. A capture filter decides what gets recorded at all, using the classic BPF syntax, for example:
udp port 161 or udp port 162A display filter narrows what you look at afterwards, using Wireshark’s own field names:
snmp && ip.addr == 10.20.0.2Beyond the packet list, the Statistics menu summarises a capture into conversations, endpoints, a protocol hierarchy and I/O graphs, which is where you see at a glance that a collector is sending three hundred requests a minute to one switch and getting two hundred replies. The same engine is available on the command line as TShark, with dumpcap doing the recording, so captures can run unattended on a headless collector host.
Wireshark runs on Windows, macOS and Linux. On Windows, capture relies on the Npcap driver, which the Wireshark package offers to set up; on macOS and Linux, capture permissions are granted to a helper rather than to the whole application.
Where it’s strong for a buyer
- Seeing what the probe really sends. Run a capture on the collector or probe host with a filter for SNMP. You will see the SNMP version, the community string or v3 user, the OIDs requested and the reply times. A wrong community, a v2c request to a v3-only device, or replies arriving after the product’s timeout shows up within minutes.
- Judging a trial fairly. Rejecting a product because of your own firewall rule is an expensive mistake. If requests leave and nothing returns, the path or the device is the problem; if replies arrive and the product still reports a timeout, the product is. Either way, you have evidence to put in front of the vendor’s sales engineer.
- Measuring polling load. Sensor-heavy configurations can generate more polling than older switches enjoy. The conversation and I/O graph views show how many requests per minute a product’s defaults produce, which matters when you compare the “monitor everything” setups in PRTG and OpManager.
Where it falls short, and who should skip it
Wireshark is a diagnostic instrument, not a monitor. It stores no long-term history, sends no alerts and has no idea what “normal” looks like for your network. Captures grow quickly, so it is used in short, targeted sessions.
It also only sees traffic that reaches the interface it listens on. To watch conversations between two other devices you need a mirror (SPAN) port on a switch or a network tap, which is a change-controlled job on most networks. The learning curve is real, and a small office with no one comfortable reading packets may get more from the vendor’s support team.
Captures can contain passwords, personal data and business content. Capture only on networks you own or are authorized to manage, keep files for as short a time as possible, and follow your organisation’s data handling rules.
Who it suits
- IT staff running a monitoring trial who want to know whether odd results come from the product or the network.
- Network engineers comparing polling behaviour between two shortlisted products.
- MSPs who need to show a client, with evidence, why an alert fired.
Licensing and cost
Wireshark is free, open-source software under the GPLv2. There is no paid edition and no licence count. The costs are skills and time: learning display filters, knowing where to capture, and, on switched networks, access to a mirror port or tap. Some organisations also require approval before any packet capture; plan for that before the trial clock starts. For how the platforms themselves are priced, see the pricing models guide.
How it compares
Nothing on this site does the same job. The monitoring platforms poll, store and alert; Wireshark explains an individual exchange in detail. Its companion on our free discovery and troubleshooting shortlist is Angry IP Scanner, which answers the earlier question of what is on the network at all. For always-on free monitoring, look at LibreNMS or Zabbix. Our trial plan suggests when to take a capture during a two-week evaluation, and Auvik vs PRTG shows how two collectors approach the same network differently.
Getting it safely
Get Wireshark only from the project’s own site, wireshark.org, and ignore copies offered on file-sharing or “portable apps” sites. The project publishes SHA-256 hashes for each release in a signed signatures file; compare the hash of the file you received before running it, for example with Get-FileHash in PowerShell or sha256sum on Linux, and on Windows confirm the file carries a valid digital signature. Keep it updated, since security fixes arrive in regular point releases. Our where to get it safely page covers the verification steps in more detail.
FAQ
Is Wireshark free for business use?
Yes. It is released under the GPLv2 and can be used commercially without a licence fee. The GPL’s obligations apply mainly if you modify and redistribute the software itself.
Can Wireshark decode SNMPv3?
It decodes the SNMPv3 headers without help. To read the encrypted payload, you add the monitoring user and its authentication and privacy keys in the SNMP protocol preferences, which should be done only with credentials you are authorized to use, on a trial account created for the purpose.
Where should I capture during a monitoring trial?
On the collector or probe host itself, first. That shows exactly what the product sends and receives without any switch changes. Move to a mirror port near the monitored device only if the collector-side capture shows requests leaving and nothing coming back.
Does Wireshark replace a monitoring tool?
No. Think of it as a diagnostic instrument you pick up for a specific question, then put down. Continuous monitoring, alerting and history remain the job of the platform you are buying.
Before you start a Wireshark evaluation
Netops24 does not sell Wireshark and hosts no files for it. Start your evaluation on Wireshark Foundation’s own site, check the address bar shows wireshark.org, and read our where-to-get checklistfor what a trial sign-up normally asks for. Our verdict label is explained on the methodology page.